
MOLINE, Ill. — The recent wave of heat across the United States has made plenty of headlines. Temperature records falling throughout the southwest, including the longevity of 100+ degree days!
Many of you are wondering how this compares and contrasts with one of the most well-known heat waves in the U.S. — the Dust Bowl of the 1930s. Here's the question I got:
With the heat index scale in the 1930s being as much as 4 times higher than now. What is the difference between then and now in regards to global warming?
Let's start with a backstory regarding how the Dust Bowl came to fruition. No doubt the 1930s were among the top warmest periods in the United States. Demand for wheat in Europe during World War I paired with government incentives, including The Homestead Act, which provided new settlers with 160 acres of public land, led to an explosion of new farms.


These farms cleared millions of acres of natural grassland that was well-established throughout the Great Plains, in exchange for planting wheat and other crops. The Great Depression quickly followed and wheat prices crashed, sending farmers frantically tearing up even more grassland to harvest more of a crop to try and make up for the loss. By 1931, significant rounds of heat and subsequent drought developed throughout the region rendering the newly cleared farmland useless. With nothing to cover the ground, it quickly dried up and massive dust storms resulted.


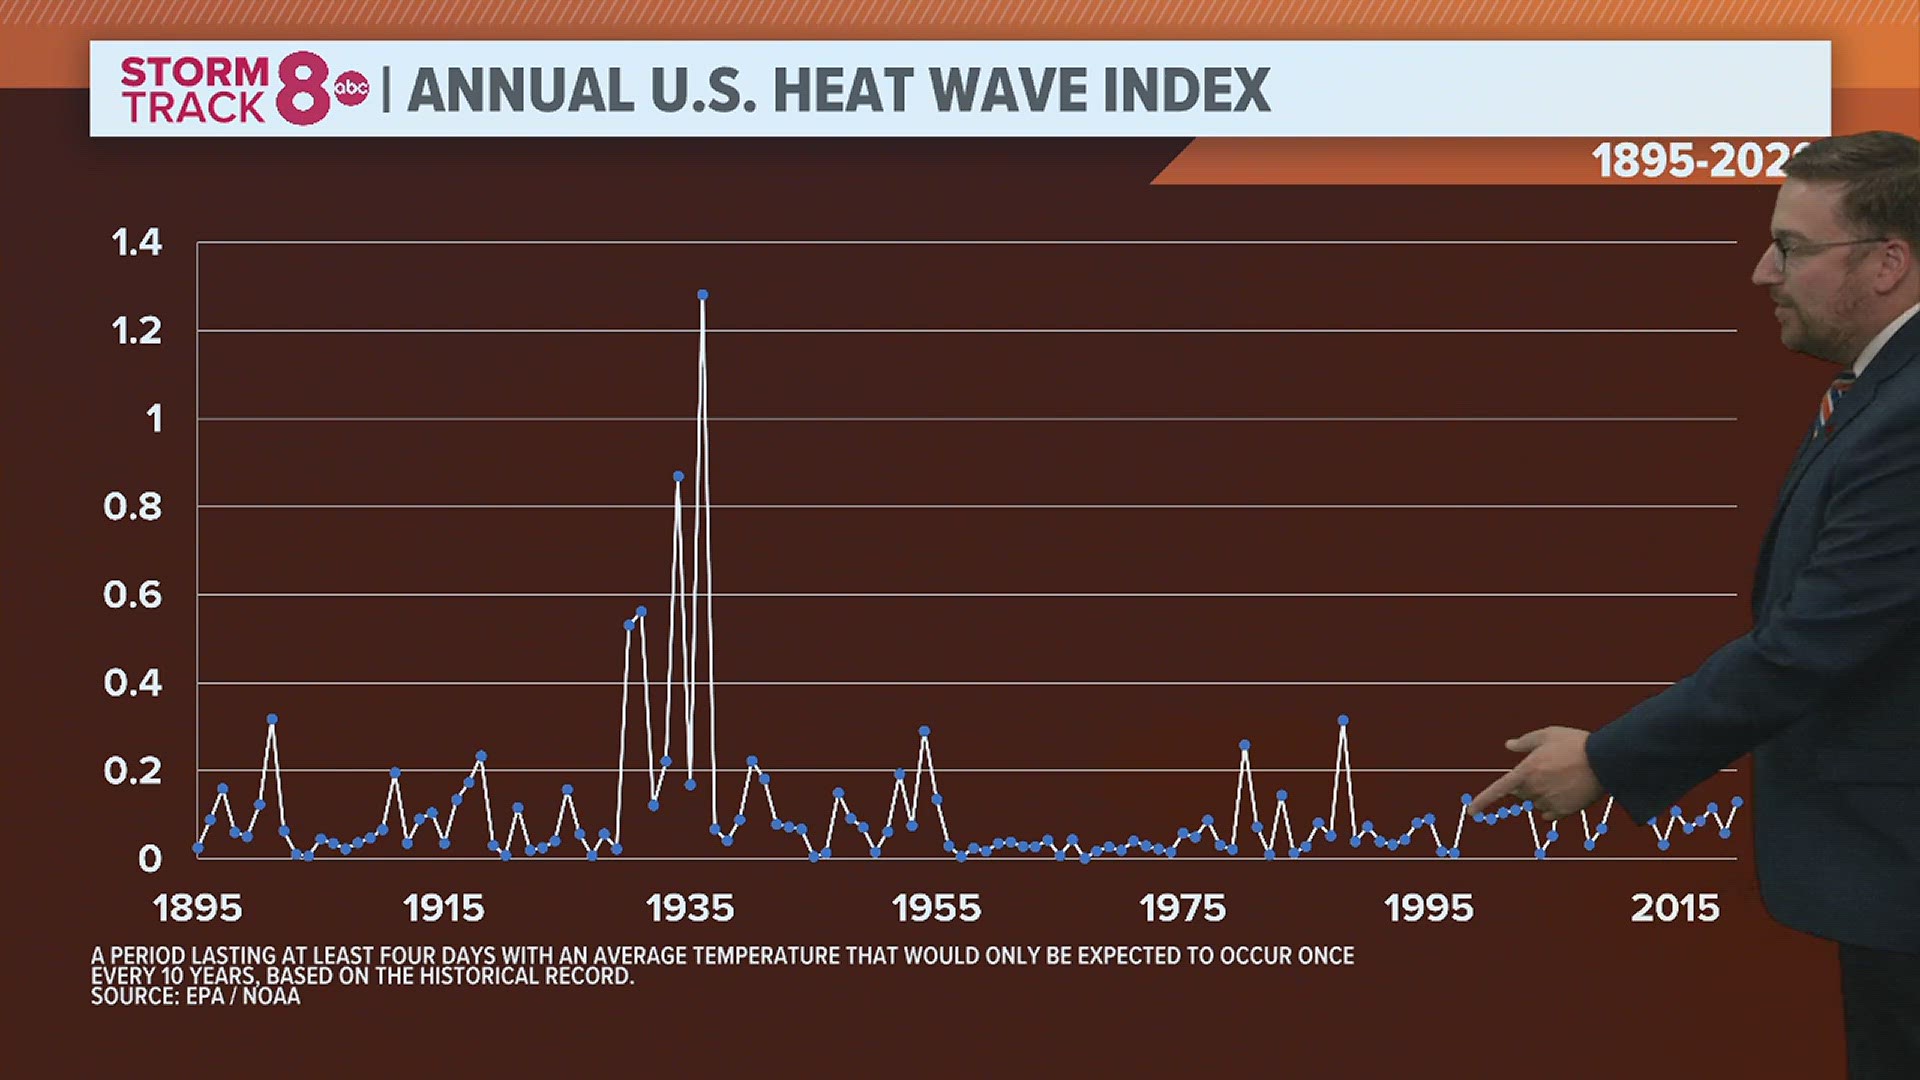
The Dust Bowl of the 1930s was actually a compounding of previous droughts, also in the 1930s as you can see in the above chart. There are several spikes downward around that timeframe indicating widespread areas of extreme drought throughout the entire U.S. Since then, we have not experienced such a trend — at least not yet. What you can see is just how variable the cycles of drought and wetness can be over a long period of time. There is also a well-known connection between widespread drought conditions and long-term weather patterns, such as La Niña. Remember, we just came out of a rare triple-dip La Niña that lasted three years.

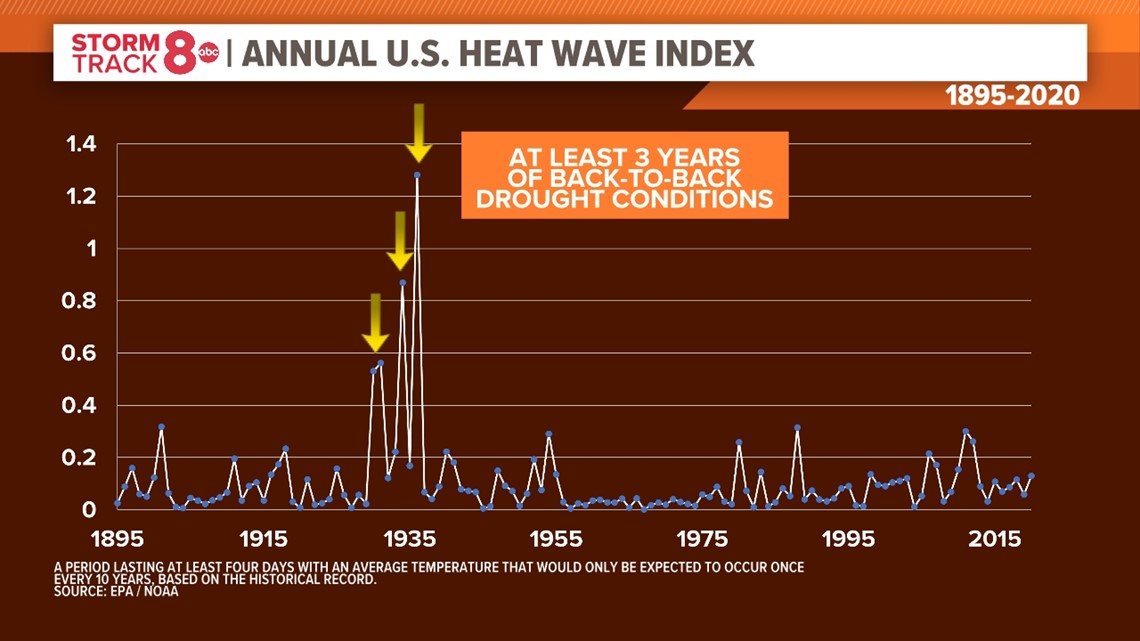
The question for today's segment is questioning the graph above which shows the Annual U.S. Heat Wave Index. It was developed by the EPA and NOAA, referencing the frequency in which a period of at least four days with an average temperature would only be expected to occur once every 10 years based on the historical record. No surprise, the Dust Bowl is one of the most pronounced heat wave periods that the U.S. has observed since the late 1800s.

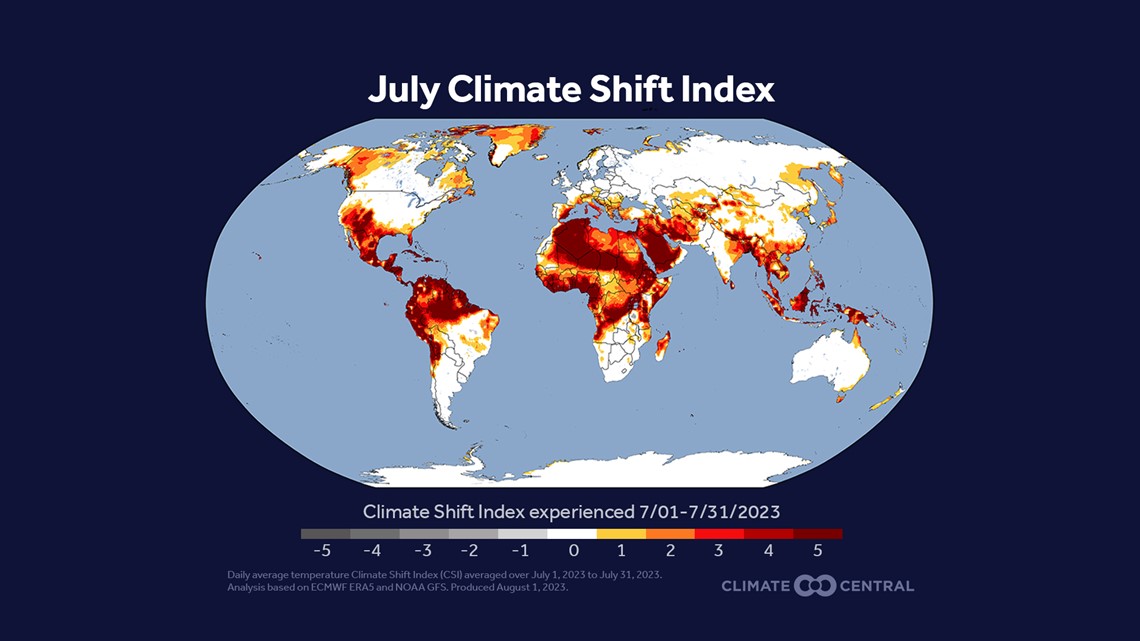
While the ongoing heat wave across the southern U.S. is impressive, it really can't be easily compared to what we saw back in the 1930s. We can however look at the larger scale across the entire globe to see just how hot July truly was. The above graphic shows what's referred to as the Climate Shift Index™. The CSI is a categorical scale, with the categories defined by the ratio of how common (or likely) a temperature is in today's altered climate vs. how common it would be in a climate without human-caused climate change. Notice how the majority of the heat was centered around the equator! So, while we weren't baking here in the Quad Cities, areas near the equator sure were! Overall, a very clear climate change signal exists.
Something else to consider
We often talk about carbon and the need to reduce its footprint in the atmosphere. However, water vapor is one of the biggest greenhouse gases out there today, and thanks to warmer global temperatures, our atmosphere is capable of storing more of it.


Back in January of 2022, when the Hunga Tonga-Hunga Ha’apai volcano erupted, it sent enormous amounts of water vapor into the stratosphere, enough to fill more than 58,000 Olympic-size swimming pools. This amount of water vapor could be enough to temporarily affect Earth’s global average temperature and may very well also explain why the Earth's global temperature is on the rise, more so in recent months!
Have a question that you would like me to answer for an upcoming Ask Andrew segment? Submit it, here.